
I have been working with some software from ROBO software called Spektrum Telemetry Viewer. STV as I’ll call it allows you to do several things based on the .tlm file that a Spektrum radio saves to the SD card when appropriately configured. Look for a link to them soon on my links page. Spoiler alert, I like the product and think it really makes the telemetry information gathered by the Spektrum TM1000 into something even more useful than what the radio can do on its own!
Using STV you can really dig in a bit more to the telemetry data that you have collected during flight. I love knowing what my battery voltage was at the high and low point in the flight, how fast, how high etc… Much of it is very cool and parts of it are excellent in determining just how well your radio link is being maintained, if your on board batteries are performing as expected and even some things related to engine performance!
As an example lets look at some data I gathered from my P51 during a demo flight at our recent air show. For reference, the P51 is running a DA-50 with a Xoar WWII style 22×10 prop. The ignition is fed through an Ultra IBEC which includes voltage regulation and is powered off of the same flight packs which power the rest of the aircraft. Those batteries are a pair of 2 cell A123 2300mah packs. These feed the Spektrum power safe 12 channel receiver. There are 9 servos plus and electronic ignition cutoff switch in the bird. All servos are Hitec brand, ranging from 5625/45 digitals, 645 analogs and a couple of standard 425s if memory serves. This is the giant scale Top Flite P51 and it weighs in around 21lbs.
For Telemetry I have the TM1000 which plugs directly into the data port on the receiver to receive flight log information as well as power. I have the head temp probe positioned a couple fins below the top of the head toward the back of the cylinder. The RPM probe is the magnetic type and it is glued into a wood stick and positioned to sense the magnet embedded in the hub that also “fires” the hall sensor. I also have the GPS module installed as well as the 3 axis 8G force sensor, the altimeter unit and air speed sensor. I have the voltage probe wired into the ignition side of the IBEC so I can monitor ignition voltage as well. Having covered all that lets look at some data.
This first graph is the RPM/Volts/Temp page: 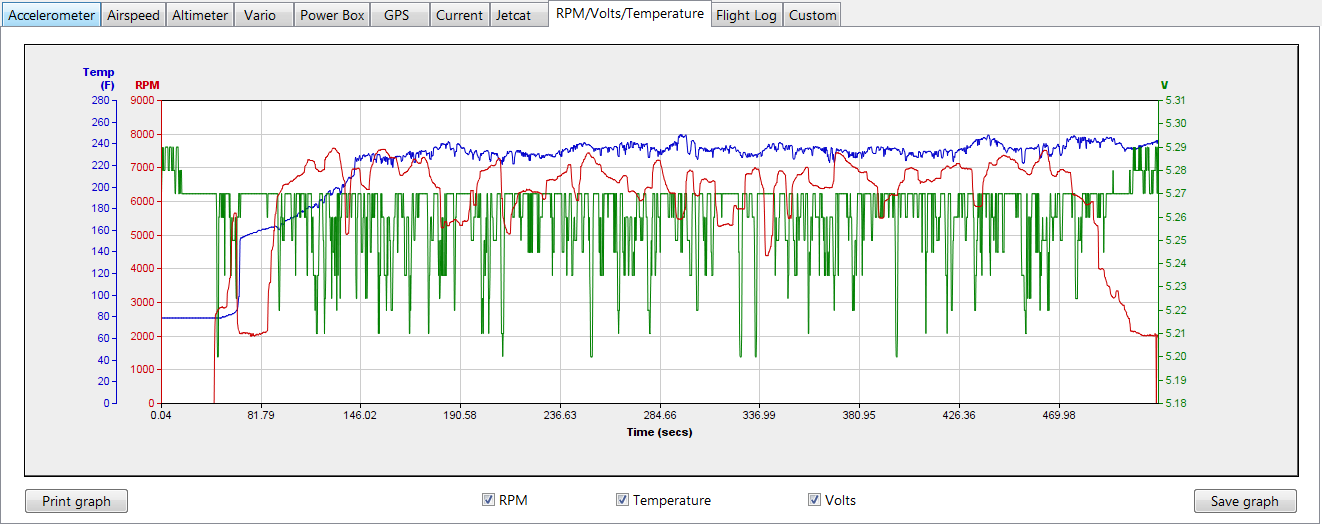
First take a look at the blue line. That is the temperature line. Looking at some of the other data I can tell you that throttle up to takeoff was around 90 seconds into this recording. According to this graph (with a bit of zooming and scrolling which the application allows for) the temperature at that point is around 170 and it takes another 30 seconds or so before the engine gets up to that 220-240 range that it appears to be in for the majority of the flight. This tells me there is no worry with the engine getting to hot sitting and running on the ground as the temperature is only very slowly rising during the time it is idle or taxiing. I always wondered with a tightly cowled engine like the Mustang just how hot it might get if forced to sit for a couple minutes on the ground. Apparently just prop wash airflow is sufficient to keep the engine cool… at least for a couple minutes! Looking at the green (voltage) line tells me my ignition is seeing anywhere from 5.17-5.29V for the duration of the session. Apparently the regulator in the IBEC is getting a fairly constant voltage source from the receiver or is doing a great job regulating what it gets as this voltage is pretty solid and what variance there is does not track with RPM. You would think running the engine at high RPM would require the most current draw and therefore cause a voltage drop if there was any problem with the regulator supplying the needed current so this is reassuring as well. Lastly, the RPM graph shows RPM readings in the air peaking around 7600 RPM. This is a good 800 RPM above static revs on the ground which is a bit more than I would have expected but not alarming and well within the limits that DA recommends. So far all looks well and I’ve learned a bit about how the engine is performing and surviving in the air.
I’ll just call this part one and move onto some other graphs and information gleaned in the next post.